Introduction to Webpages & Webmaps
One of the most important things to remember when diving into web maps is that they are not magic. They may at first seem like wizardry, but if you take a deeper look webmaps are built from regular ingredients that go into making a webpage. This tutorial/write-up will cover the key ingredients that go into a properly formed webmap,
INGREDIENTS
The phrase “webmap” can mean a lot of things. The following will describe slippy, tile-based maps. For a more robust introduction of webmaps, please take a moment to read Maptime’s anatomy of a webmap.
Webpage
At the core, a webmap is simply a webpage. It is comprised of HTML, CSS, and JavaScript. These three components bring together webpages and are the basis of mapping-specific technologies.
The web is structured very similarly to the english language. We have nouns, verbs, and adjectives that all work together to make a meaningful and interesting sentence. Those sentences can be structured linearly to form a paragraph, which can be combined into a novel.
There are also many different ways to express the same concept in our language. For example, say we are expressing our interest to get a beer. I'd say, "Let's go get a beer!" to my friend. In a different, but parallel universe, I may have said "Friend, let us drink a beer together." Pretty similar in the end, right? *Right.* Both sentences result in me and my friend drinking a beer (hopefully). The difference is in the structure and words I've used to convey that message.
Like nouns, adjectives, and verbs, the web (in its simplest form) is made of HTML, CSS, and Javascript. These are the driving forces that work together to create your ~~sentence~~ webpage. With these three components, you can make a completely whole, modern, and dynamic webpage and website.

Mapping Library
Loading specific geographic data into your webpage requires a lot of work. Thankfully, there are some really great mapping libraries out there that help us do this. The one we’ll be talking about today is called Leaflet, “Leaflet is a modern open-source JavaScript library for mobile-friendly interactive maps.”
This library includes a Javascript file used to manipulate and bring together data, and a CSS file that gives some preliminary styles and images to use for making your map.
There are tons of mapping libraries out there, many of which do virtually the same thing as leaflet as far as this tutorial goes. There are open source and closed sourced projects all of which have significant advantages and downsides. Some important ones:
Open Layers is another open source project that has actually been around longer than Leaflet. This project has evolved quite a bit over time and is now quite competitive in the mapping world.
Google Maps provides you with all of the power at maps.google.com and allows you to customize the interaction of your data. It's a great mapping system that has pushed the open source mapping community since its popularity. There are load limits for how many times your map can be loaded before paying, though.
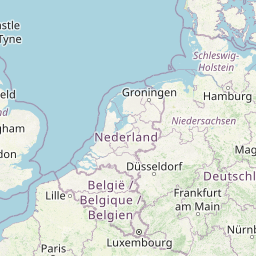
Tiles
Map tiles are the basemap of your page. You can see them in action on the open street map website. Though it may look like a fluid map, these basemaps are actually created from many, many 256x256px images stitched together. There are different images for different zoom levels, which show specific information appropriate to the scale in which you are viewing the map.
The Mapbox "How do webmaps work?" writeup is really great. They explain how tiles are created and why they are great. It's important to note that making a map with tiles isn't the only way to do it either. Take a look at d3js.org to learn about vector-based web cartography.
Data
Geographic data come in many formats, such as Shapefiles if you’re familiar with GIS and desktop mapping software. It is no different on the web due to many different ways of storing data in general via the web. The most common format we’ll be exploring is called geojson, which is a subset of JSON (javascript object notation). The mapping libraries described above are quite good at consuming these formats and turning them into standard web elements on a layer of tiles.
GeoJSON is the standard web format for geospatial information. It is based on JSON, which is an object readable data format for Javascript. GeoJSON takes this and essentially standardizes the nomenclature for spatial information, such as latitude and longitude. Take a look at the GeoJSON specification to learn more.
LET’S GET STARTED
At this point, we’re assuming you have a working text editor on your computer that allows you to edit your code. If you don’t download Sublime Text to get started.
Create an .html file
Through your text editor you can create a new .html file - name it map.html. You can save this anywhere on your computer. Simply open it by double-clicking it. Your preferred browser should open up showing this file. If this doesn’t happen, open up your browser and click and drag map.html into it as a new tab.
Add a boilerplate to map.html
The following code is a very basic version of a webpage. It consists of the <html>, <head>, and <body> tags that are the basis of a web page’s HTML structure. You can copy and paste the code into map.html, press save, and refresh your webpage in your browser.
Despite there being many ways to create a webpage, there are still some standards to stick to, which make your page readable by a browser (Chrome, Firefox, Internet Explorer, etc.). Below is a bare-bones example of a webpage. It is purely HTML and includes three important "tags", <html>, <head>, and <body>.
The <html> tag declares to the browser that this file is, in fact, an HTML file. The <head> tag is where you define the metadata for the webpage you are viewing, such as the <title> tag and your <meta> tags, which are used by browsers and other search engines to effectively identify and process your webpage. This is also where you can declare your CSS and Javascript.
By combining these web elements, CSS, and Javascript, you can assemble a webpage in any way you like.
You should see the a couple things on this page. First, the background-color has changed via the background-color:green; declaration in the <style> tags. This is CSS, which adds styles to your web page’s elements.
Include the Leaflet library
Now you can insert Leaflet into your page. Remember there are two files to include, the CSS and JavaScript files. For now we’ll use an externally hosted version of the library instead of copying it into a new file. Add the following in between the <head> tags of map.html, after the <title> tag.
<link rel="stylesheet" href="http://cdn.leafletjs.com/leaflet-0.7.3/leaflet.css" />
<script src="http://cdn.leafletjs.com/leaflet-0.7.3/leaflet.js"></script>
Linking resources is important in building a website, it allows you to re-use files across different webpages without having to copy them over and over. This is especially important when you have hundreds of webpages and need to make updates (to your CSS file, for example). You only have to update **one** file instead of hundreds of files.
This concept can be applied to more than just your own files as well. You can use resources from all over the web for your own site. Using external resources allows us to link to special files across the web in order to take advantage of their unique components so we don't have to write them ourselves. This concept is the basis of how we use different tools on the website that may have been created by other people in order for us all to use. We may not necessarily know how they are made, but we know how to use them for our own needs.
You don't necessarily know what a chainsaw is built of or how it works, but you know how to use it to cut down trees.
Linking files
CSS and Javascript files are the most common filetype to link to across the web. There are many libraries that include both a javascript file and css file that work together to provide special tools for you to use.
CSS can be linked via the `` tag and `href` attribute.
<link href="style.css" rel="stylesheet">Javascript can be linked via the <script></script> tags and src attribute.
<script type="text/javascript" src="script.js"></script>Notice the above files style.css and script.js are located in our own file system since we didn't define an http://www... address. Say you wanted to bring in a javascript file from another website, you would would do the same thing but with the full web address.
<script type="text/javascript" src="http://www.example.com/javascript/script.js"></script>Prepare your HTML & CSS
You’ll need an element for your map to bind to on the webpage. This element will require an ID to be referenced in your javascript when you intialize your map below. The size of your map on your webpage will depend on the CSS styles you assign to this element. So, let’s assume we want to work with an element with the id of #map. You’ll want to add a <div> element in between the <body> tags of your page.
<div id="map"></div>
To specify the dimensions of the map, we’ll access it in the <style> tags in our document via the #map ID.
#map {
  width:600px;
  height:400px;
  background-color:#c0c0c0; /* just to ensure the element is there */
}
Initialize the map
Right now the #map element is simply an HTML element without a map. In order to bind a map to it, we have to initialize a Leaflet map instance and associate it to the element.
var map = L.map('map').setView([0,0], 5);
You now have a variable map that is associated to an entire Leaflet map instance. This variable is how you will add and update your map attributes, add tiles and data, and manipulate the object to do what you need it to. You can see above that we are doing one more step than initializing the map – we are using the setView() method to pass our geographic center [0,0] and zoom level 5 for the map to start at. NOTE: you won’t be able to really tell where you are at in the world yet since we don’t have a basemap to reference, don’t worry!
Add a tile layer
Adding a tile layer will require the tileLayer() method from the Leaflet library. You’ll also need the URL reference to a tileset. There are many different tile providers out there, some of the more prominent in the open source world are OSM and Mapbox. The OSM default tiles can be accessed at http://a.tile.openstreetmap.org/{z}/{x}/{y}.png. In the URL, you can see three variables {z}, {x}, {y} which relate to a specific .png file to be used in the map depending on the zoom level and displayable area.
To add a layer, add the following after your line initializing the map:
L.tileLayer('http://a.tile.openstreetmap.org/{z}/{x}/{y}.png').addTo(map);
The above generates a tile layer and via the addTo() method, it applies it to your map variable.
Update the center values in setView() to a [lat,lng] value of your choice and refresh the page - you should see the map center update to your new points with a basemap!
Add a point
Finally, what we’ve all been waiting for! Adding a single marker in Leaflet is a breeze. Let’s call the marker() method, which can accept a few parameters.
var marker = L.marker([0,0]).bindPopup("<p><strong>Hello</strong> Maptime!</p>").openPopup().addTo(map);
Again we can see the marker being added to map at the end. There are two other methods we are calling, bindPopup(), which allows you to write in a message for the map’s popup, and openPopup(), which will open the popup (as if you clicked on it) when the marker is added to the map.
NOTE: You’ll want your marker’s lat,lng to be in the same extent as your map’s lat,lng. For now, it’s best to just make them the same!
CHALLENGE
Now that you have a map with a sweet marker, try these extra challenges that allow you to extend the Leaflet library.
- Update the popup with your name and birthday. Hint: inside the
bindPopup()method. - Add a line or a polygon to the map. Hint:
polygon()method - Make the map fullscreen in your browser. No borders, no nothing!. Hint: use CSS
RESOURCES
- Leaflet API: reference to all Leaflet methods and options
- Leaflet Extras: Basemap examples and preview
- Leaflet Starter Project: put together by CUGOS!
- “Let’s make a web map”: Lyzi Diamond’s presentation for making a web map
Please fill out our post tutorial survey when you are done with the tutorial! If you were unable to attend the maptime meeting, please fill it out anyways if you want to provide feedback for future meetings!